Motorcycle theft rose 5% in the 2017/2018 financial year while all other vehicle theft across Australia dropped.
Official figures from the National Theft Reduction Council (NTRC) show motorcycle thefts were up 381 to 8471.
It follows several years of low growth in motorcycle theft.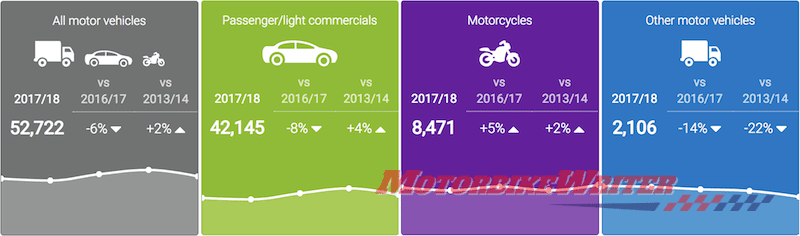
The highest growth of any state was Queensland, up 7.8% to 11,733, representing 22.3% of total national motorcycle thefts.
Thefts were down in all other states and territories, except the ACT which was up 14.5% to 1257, although it represents only 2.4% of national bike thefts.
The biggest drop was in Tasmania which was down 2.7% to 1046.
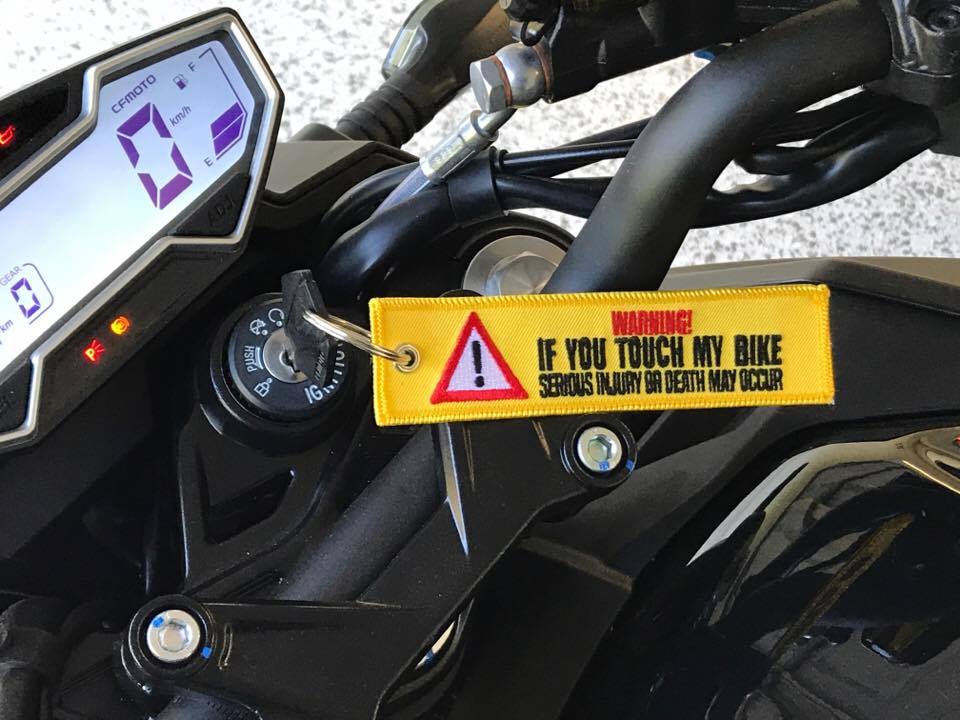 Buy your “warning” keyring now at the Motorbike Writer online shop.
Where theft occurs
| State or Territory | 2016/17 | 2017/18 | % change | Theft rate per 1,000 registrations | |||
|---|---|---|---|---|---|---|---|
| Thefts |
% of thefts
|
Thefts |
% of thefts
|
2016/17 | 2017/18 | ||
| ACT | 1,098 | 1,257 | 14.5% | 3.75 | 4.18 | ||
| NSW | 12,302 | 12,059 | -2.0% | 2.24 | 2.15 | ||
| NT | 1,106 | 881 | -20.3% | 6.87 | 5.43 | ||
| QLD | 10,883 | 11,733 | 7.8% | 2.62 | 2.76 | ||
| SA | 3,256 | 2,999 | -7.9% | 2.27 | 2.00 | ||
| TAS | 1,319 | 1,046 | -20.7% | 2.81 | 2.21 | ||
| VIC | 18,248 | 15,164 | -16.9% | 3.66 | 2.97 | ||
| WA | 8,107 | 7,583 | -6.5% | 3.55 | 3.31 | ||
| AUS | 56,319 | 100.0 | 52,722 | 100.0 | -6.4% | 2.92 | 2.68 |
Since Queensland had the highest growth rate of motorcycle theft, several local authority regions in the south-east are hot spots for bike theft.
| State or Territory | LGA | 2013/14 | 2017/18 | % change |
|---|---|---|---|---|
| QLD | Brisbane (City) | 133 | 162 | 21.8% |
| QLD | Gold Coast (City) | 91 | 132 | 45.1% |
| VIC | Melbourne (City) | 63 | 116 | 84.1% |
| VIC | Port Phillip (City) | 34 | 82 | 141.2% |
| QLD | Logan (City) | 91 | 80 | -12.1% |
| WA | Rockingham (City) | 88 | 76 | -13.6% |
| QLD | Moreton Bay (Regional Council) | 71 | 72 | 1.4% |
| ACT | Greater ACT | 69 | 71 | 2.9% |
| WA | Armadale (City) | 81 | 70 | -13.6% |
| WA | Swan (City) | 52 | 70 | 34.6% |
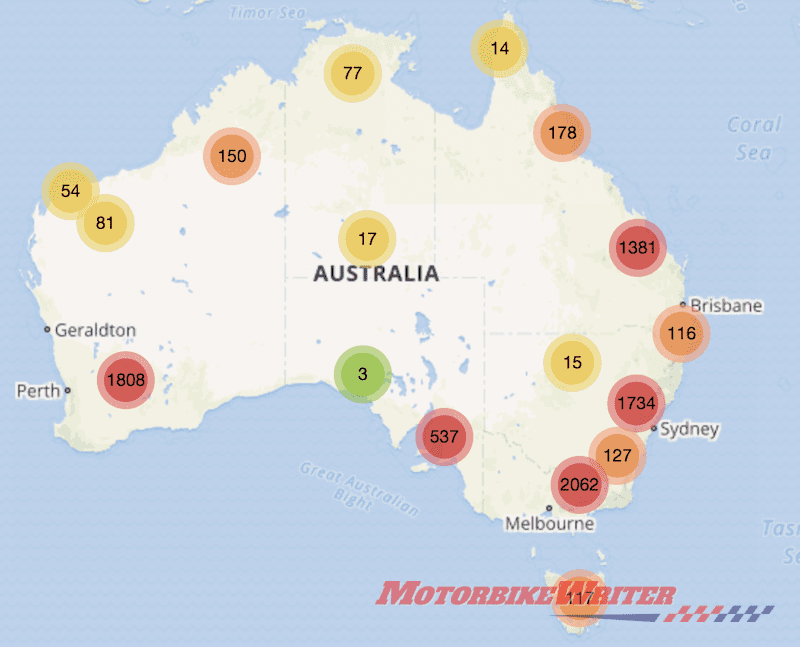
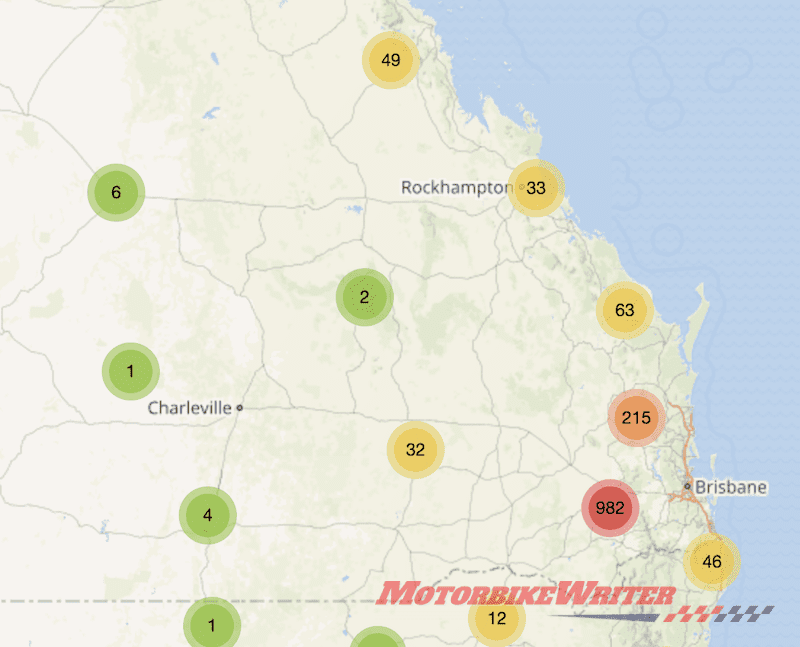
The NTRC website includes a “Motorcycle cluster map” which is an interactive map of motorcycle theft.
“By understanding the theft risk in their local area, riders can take action to protect their motorcycle,” the council says.
Click on the circles on the national map for a closer view of the selected region.
What was stolen
The most stolen motorcycles were those made between 2000 and 2010 (42.3%), followed by bikes built since 2010 (29%).
Since Japanese motorcycles dominate sales, they also top the statistics in the most stolen brands.
However, there is also a high incidence of dirt bikes and Chinese-made scooter brands as these are lighter and easier to steal.
| Make | 2013/14 | 2017/18 |
|---|---|---|
| Honda | 868 | 962 |
| Yamaha | 888 | 919 |
| Suzuki | 411 | 426 |
| Kawasaki | 350 | 383 |
| KTM | 317 | 370 |
| Harley Davidson | 116 | 185 |
| Husqvarna | 61 | 87 |
| Piaggio | 45 | 72 |
| Triumph | 52 | 69 |
| Hyosung | 51 | 67 |
| SYM | 49 | 58 |
| Kymco | 34 | 55 |
| Ducati | 35 | 54 |
| TGB | 47 | 48 |
| Aprilia | 25 | 46 |
| Polaris | 30 | 44 |
| Vespa | 29 | 39 |
| Atomik | 53 | 36 |
| Longjia | 54 | 35 |
| BMW | 15 | 32 |
When bikes are stolen
| Earliest possible time of theft | Monday | Tuesday | Wednesday | Thursday | Friday | Saturday | Sunday | Total |
|---|---|---|---|---|---|---|---|---|
| 00:00 – 03:59 | 82 | 62 | 59 | 82 | 69 | 94 | 87 | 535 |
| 04:00 – 07:59 | 64 | 62 | 50 | 55 | 71 | 43 | 42 | 387 |
| 08:00 – 11:59 | 90 | 88 | 93 | 96 | 100 | 107 | 89 | 663 |
| 12:00 – 15:59 | 104 | 101 | 92 | 101 | 131 | 130 | 123 | 782 |
| 16:00 – 19:59 | 177 | 153 | 159 | 175 | 235 | 210 | 174 | 1,283 |
| 20:00 – 23:59 | 142 | 157 | 142 | 143 | 143 | 136 | 177 | 1,040 |
| Total | 659 | 623 | 595 | 652 | 749 | 720 | 692 | 4,690 |